 Skip to main content
S&P 500 Performance Analysis
Prepped for Performance Promotion?
While we certainly never recommend strictly selling past performance in your investment offerings, it is inevitable that clients are exposed to trailing market results in both marketing materials and comparative analyses. The S&P 500’s all-important trailing 5-year number turned positive in 2006 and hovered around slightly positive territory through May 31, 2006. Holding future performance constant, the five-year results have the potential to improve even more in September after the very negative third quarter of 2001 drops out of the results.
The same thing should occur next year after the second and third quarters — results in the second and third quarters of 2002 pushed the index lower by around 30%. While this is certainly dependant on the results in the coming months, shorter-term trailing results could paint a more positive picture for the equity markets, while 10-year results would be more balanced with both up and down markets.
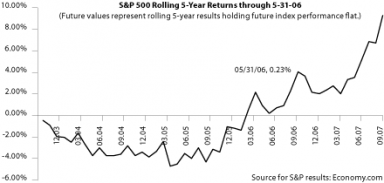
The graph displays rolling 5-year performance for the index and projects future five-year results holding performance flat from June 2006-September 2007. This is done only to display the relative results as negative past performance drops out of the trailing results and does not reflect any prediction of future market performance.